
Vitals performance
Performance is part of our core engineering principles. We have been tackling performance from many angles, API response times, caching strategies, resource parallelization, CPU usage and more. While some performance metrics are easy to measure and monitor some can be quite challenging.
Our latest performance monitoring has focused on the general user perceived performance. This has always been challenging as users have a multitude of devices, use different browsers and network connections. Doing Real User Monitoring (RUM) would show quite a big difference when analyzing the data. A great tool that helps in this regard is Lighhouse. Lighthouse is already built into Chrome and can also be installed as an extension in other browsers or just by accessing the public url.
Lighthouse provides a set of guidelines that a website needs to follow in order to offer the best experience in terms of: Performance, Accessibility, Best Practices and SEO.
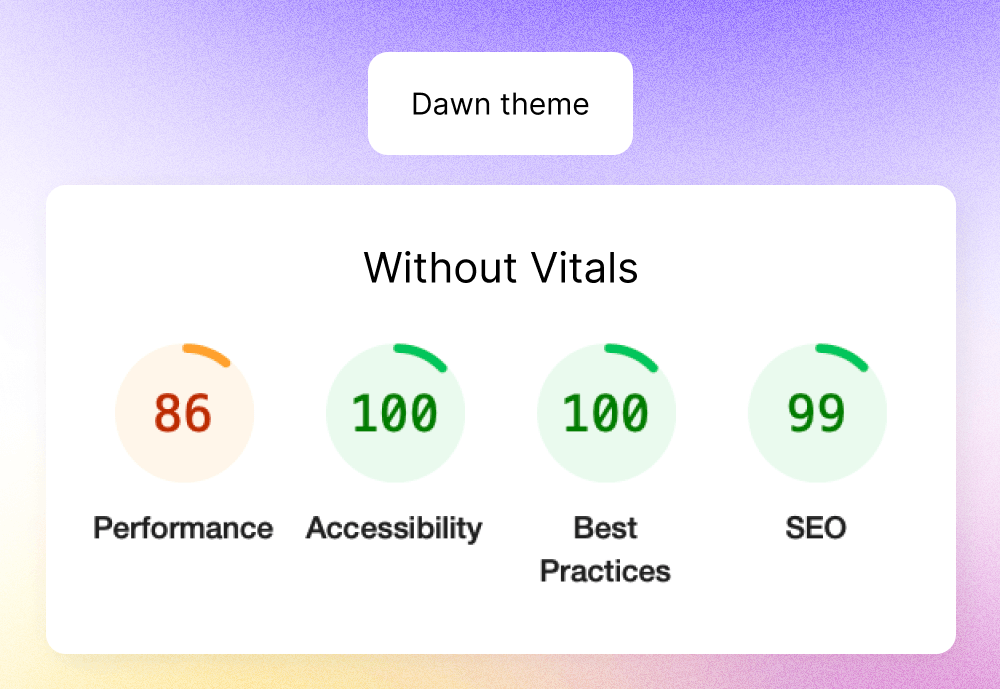
Here’s how the Lighthouse report looks like for a fresh Shopify store (Dawn theme) without Vitals:
And here’s how it looks like with 28 Vitals apps active (which is quite a high number for a single shop to have):
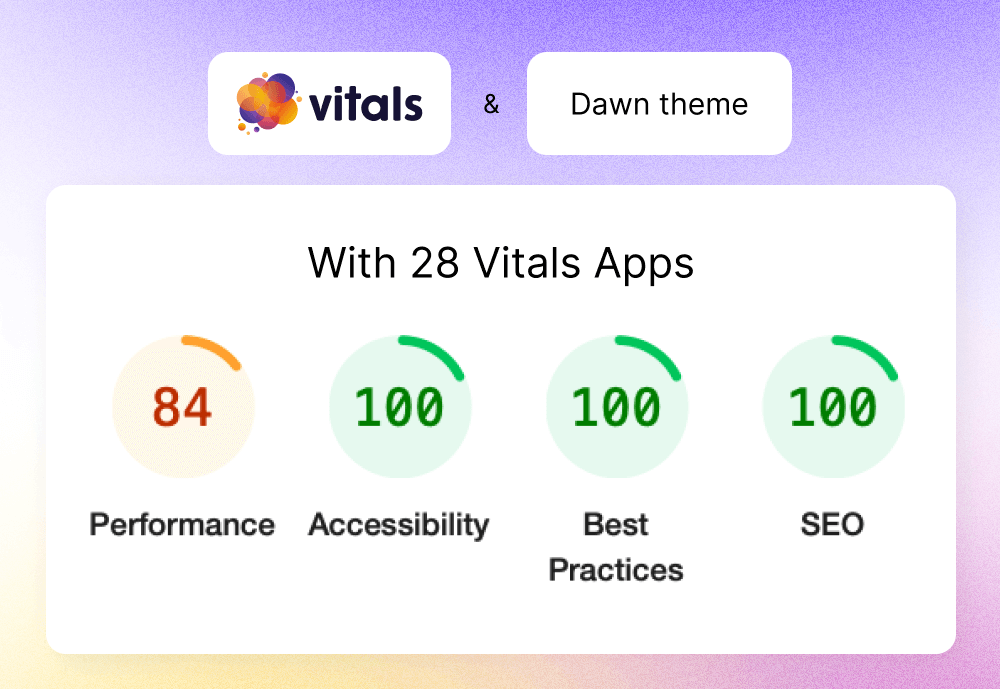
As you can see, installing Vitals on your Shopify store has a very small impact on your site’s speed – and don’t forget this is with a high number of apps activated, when you have fewer, the impact is even lower.
But as all good things, there was a very interesting journey behind this success.
So let’s see where we started a few months ago. This is how the same fresh Shopify store looked like with Vitals when we first started this journey:
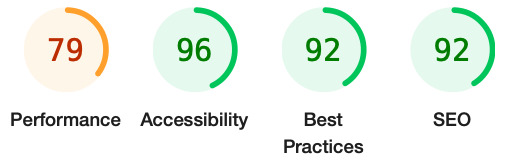
This is when we said “this is not good enough“. We split the effort into two big parts: improving the score and monitoring.
Improving the score
We started addressing all the categories with some of them requiring more investment than others. For e.g. we needed to change the architecture of our module loading mechanism in order to improve performance by 4 points and at the same time needed to just add some alt attributes to images in order to increase the SEO and Accessibility by 10 points.
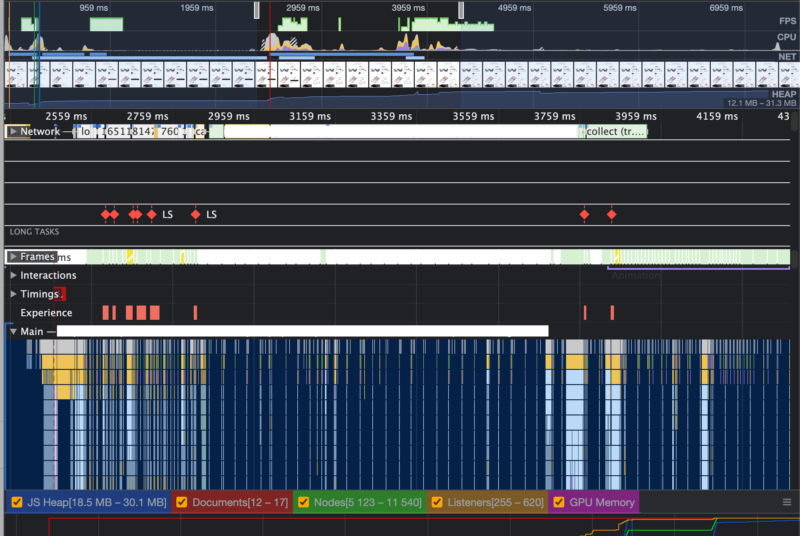
For the Performance analysis we used Chrome’s Performance Audit tool. This is where we realised that we have a big list of long running tasks that basically don’t allow any user input until they are finished.
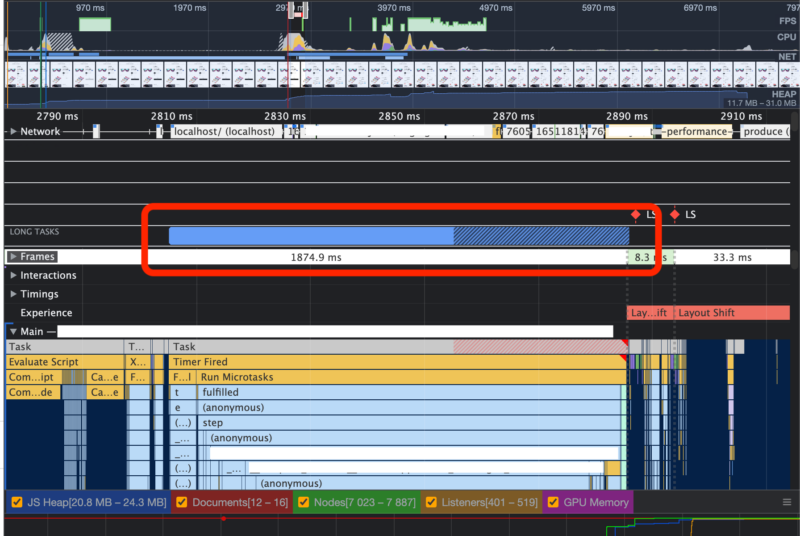
After our architecture change the big list of running tasks is gone and the user input is not blocked anymore – this was a big change both in terms of code but also as score improvement.
Monitoring & alerting
It’s pretty easy to manually run an audit on a website and see the report for yourself. However, that’s not very useful in a highly automated environment like ours so we took all the advantages that Lighthouse offers and we integrated it as part of our Continuous Integration flow.
What this means is that on every new build that we create, we also spawn a dedicated machine where we run Lighthouse CI and execute 5 audits (the performance score can vary so we want an average) on a Shopify store that we created specifically for this. Once the audits run we get an event on one of our Slack channel with the report,
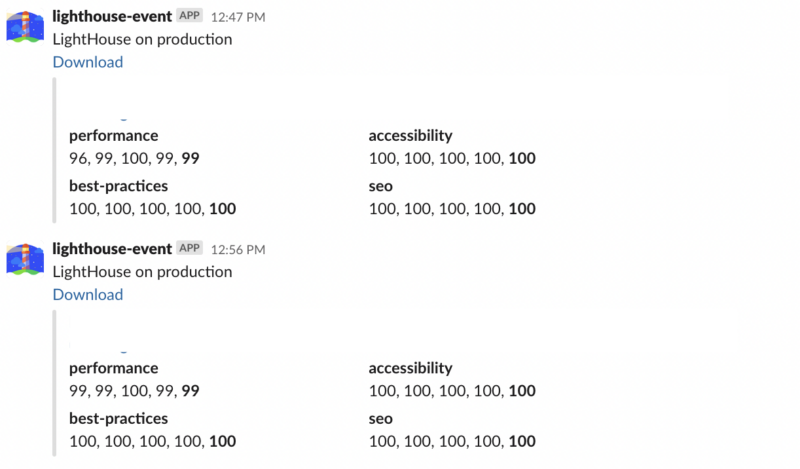
Lighthouse event notifications for each build
However, this is just for historical purposes in order to see how things have evolved over time, in case we negatively impacted the performance at some point.
The most important part here is our alerting mechanism based on the Lighthouse score thresholds. For e.g. for the Accessibility, Best Practices and SEO categories we have a threshold of 100. If any of these scores drop even by 1 point, our team gets immediately notified that the latest changes had a negative impact. For Performance we use a lower threshold of 95 points as this category score varies a bit from run to run – this is where the historical data comes in handy. In case we slightly impacted performance over time but we don’t hit the threshold we would be able to trace back to where performance started dropping.
Also, what’s really important to note here is that all this happens before a new build is deployed to Production, which means we can catch the problem before the changes go live.
Now, you’re probably wondering what’s with the high scores above. If you run a Lighthouse audit on any website (even on Google)m, in your browser, the scores would be lower. That’s normal. We run everything in an isolated and clean environment and we also keep the Shopify store we’ve created for this as light as possible – we’ve only added Vitals to it.
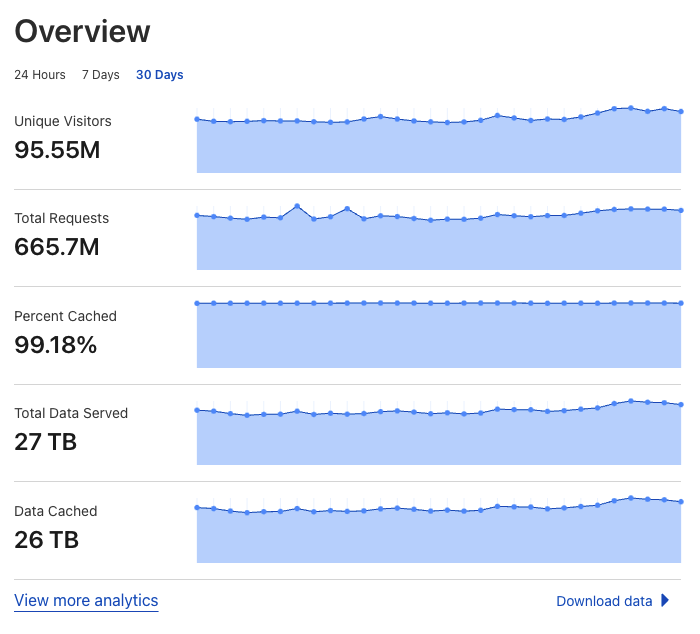
You’re probably wondering what’s such a big deal with the Lighhouse score and why we invested so much effort in this. You might even say that a few points in this report doesn’t even mean anything and might not even impact the user’s performance. That might be true in many scenarios, however, for us this is highly important because Vitals runs for ~100M unique visitors. This means a lot of devices considering most of our traffic is mobile, which means that the improvements we’ve made, especially regarding performance, bring even more value to users that don’t have the latest flagship phone. Below you can see our Cloudflare traffic stats.
So this is where we are today but we’re not stoping here. We continue to improve our score so that Vitals will have zero negative impact on any Shopify store. Also, new performance techniques come up every day and we are committed to continually improving our performance by staying up to date and using these techniques, reducing our bundle size and making sure we follow the most recent guidelines on this topic.
0 Comments